 Fluxx Tech
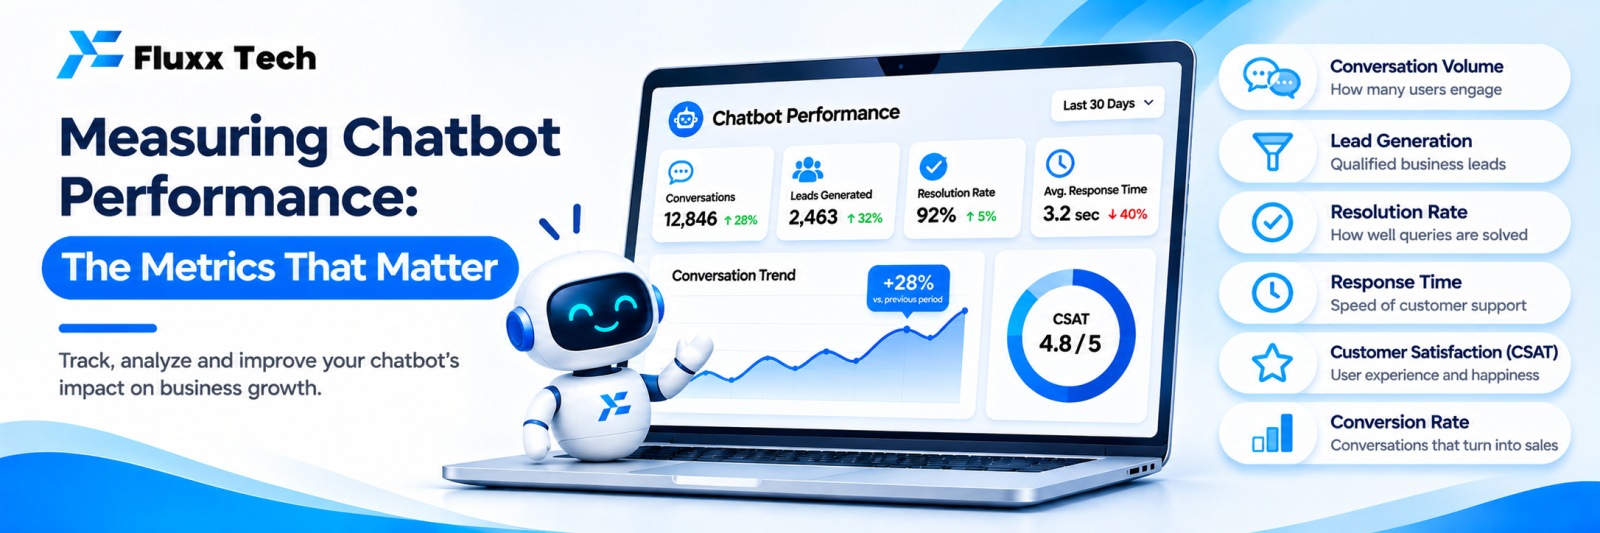
A chatbot that answers 3,000 messages a month looks impressive until you discover that most of those customers then asked for a human, or left. Message volume is not performance.
These are the numbers that tell you whether the bot is earning its place, and what to do about each.
The core five
1. Containment rate
The share of conversations the bot resolved without a human.
What good looks like: it depends entirely on your mix. A bot answering address, timing and price questions should contain most of them. A bot facing complex custom enquiries will not, and should not.
If it is low: your keyword coverage is thin, or the bot is being asked things it was never meant to handle.
If it is suspiciously high: check whether customers are being contained or simply giving up. Containment with no human handover and no conversion is abandonment wearing a badge.
2. Fallback rate
How often the bot did not understand and sent its default reply.
This is your to-do list. Every fallback is a question you have not built a rule for. Export the fallback messages weekly and read them; it is the single most useful fifteen minutes in running a bot.
Target: falling month on month. A rising fallback rate means customers are asking about something new, often a product change or a campaign nobody told the bot about.
3. Handover rate and handover quality
How often conversations go to a human, and what state they arrive in.
Handover is not failure. A clean handover at the right moment is a success. What matters:
• Did the human have the conversation context?
• Did the customer have to repeat themselves? (If yes, that is a real failure)
• How long did the customer wait after handover?
• Did the bot hand over for the right reasons?
Watch: conversations where the customer asked for a human more than once. That is the bot refusing to let go, and it damages the relationship more than having no bot at all.
4. Customer satisfaction
One question after the conversation: “Was this helpful? 1–5.”
Compare bot-only conversations with human-handled ones. A gap is informative: a small gap means the bot is doing well on what it handles; a large gap means it is handling things it should hand over.
5. Conversion
The commercial test. Of conversations the bot handled:
• How many became qualified enquiries?
• How many became customers?
• What revenue did they produce?
A bot with excellent containment and poor conversion is efficiently losing you business.
Supporting metrics
Metric | What it tells you |
Conversations started | Demand, and whether your CTAs work |
Messages per conversation | Very high means the bot is going in circles |
Time to first response | Should be seconds |
Time to resolution | Bot versus human comparison |
Drop-off point | Where customers stop replying: usually one specific message |
Top intents | What people actually ask, ranked |
Repeat questions in one conversation | The answer was not understood |
Cost per conversation | Especially where AI is involved |
After-hours conversations handled | Value the bot adds outside working hours |
Drop-off point is the most actionable of these. If 40% of customers stop replying after one particular message, rewrite that message.
Metrics that mislead
Metric | Why |
Total messages sent | Measures activity, not outcomes |
Number of rules built | More rules is not better; used rules are |
Containment alone | Can hide abandonment |
“Accuracy” quoted by a vendor | Measured on their data, not your customers’ phrasing |
Hours saved, estimated | Usually a sales number, not a measured one |
A monthly review routine
Thirty minutes, once a month:
1. Read 20 real conversations. Not metrics, actual transcripts. Pick a mix: contained, handed over, dropped off.
2. Export all fallbacks. Group them into themes.
3. Add three to five new rules for the most common fallback themes.
4. Rewrite the message with the highest drop-off.
5. Check the top intents and confirm those answers are still correct: prices change, offers expire, timings shift.
6. Review handover conversations for cases where the bot should have handed over sooner.
7. Check conversion and cost, and compare with last month.
Point 5 catches the most damaging failure mode: a bot confidently quoting last season’s prices because nobody updated it.
Set a baseline before you judge
Before launching, record what you have now:
• Average first response time today
• How many enquiries go unanswered in a week
• How many arrive outside working hours
• Current enquiry-to-customer rate
Without this, you cannot say whether the bot improved anything, and every discussion about it becomes an opinion.
What a healthy bot looks like after three months
• Fallback rate falling steadily
• Containment stable, with conversion holding or rising
• Handovers happening early, with context passed
• Customers rarely asking twice for a human
• After-hours enquiries no longer lost
• The team spending their time on real conversations rather than “what is your address”
Frequently asked questions
What is a good containment rate? There is no universal number. Compare against your own baseline and your conversion rate.
How often should I review the bot? Weekly for the first month, monthly after that. Bots decay quietly when nobody looks.
Should I measure the bot or the whole inbox? Both. The bot’s job is to improve the inbox’s overall numbers, not to score well in isolation.