 Fluxx Tech
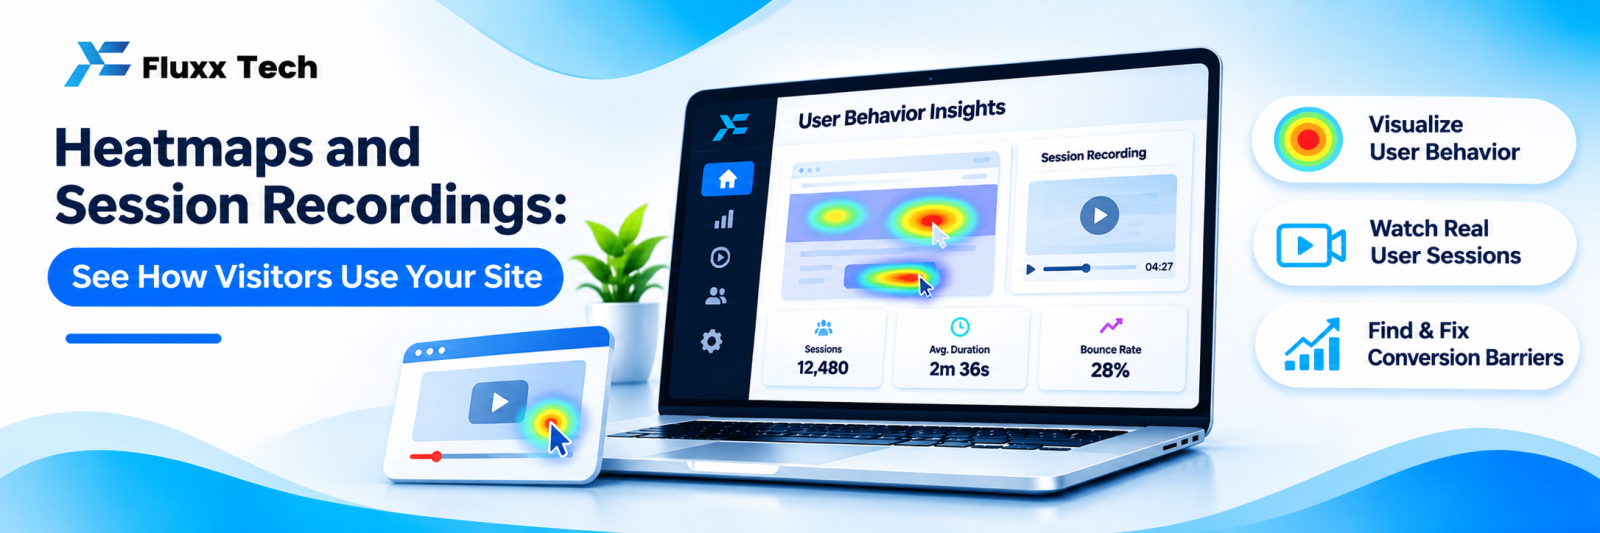
Analytics tells you that 70% of visitors leave your pricing page without enquiring. It does not tell you why. Heatmaps and session recordings show you what people actually did: where they looked, what they tapped, where they gave up.
The four tools
Click or tap maps. Where people click. Reveals two things reliably: buttons nobody presses, and non-clickable elements people keep tapping because they look clickable.
Scroll maps. How far down the page people get. If your enquiry button sits below the point where 80% of people stop scrolling, that is your problem, and no amount of copywriting fixes it.
Movement maps. Where the cursor goes on desktop. A rough proxy for attention; treat it as suggestive, not conclusive.
Session recordings. A replay of an individual visit: scrolling, clicks, form interaction, hesitation. The most informative and the most time-consuming to use.
What to look for
Pattern | What it usually means |
Rage clicks, the same spot hit repeatedly | Something looks clickable and is not, or is broken |
People tapping an image or heading | They expect it to be a link |
Scroll stops right before the CTA | Your CTA is too low, or the content above is losing them |
Form started, abandoned mid-way | A field is too intrusive, confusing or broken |
Rapid back-and-forth scrolling | They are hunting for something they cannot find: price, contact, delivery info |
Long pause on one section | Either very interesting or very confusing; watch a few recordings to tell which |
Quick exit on mobile only | A mobile layout or speed problem |
Where to start
Do not record everything. Pick the pages where money is lost:
1. Homepage
2. Your main service or product page
3. The pricing page
4. The enquiry or contact page
5. Checkout, if you have one
6. Any page with high traffic and low conversion
How much data you need
• Heatmaps: a few hundred sessions per page before patterns mean anything
• Recordings: ten to twenty is enough to spot an obvious problem; watch more only if nothing stands out
• Always segment mobile and desktop separately. They behave completely differently, and a combined heatmap hides both stories.
Filter recordings to the ones likely to be interesting: sessions with rage clicks, sessions that abandoned a form, sessions over a certain duration. Watching random visits is a poor use of an afternoon.
Privacy, seriously
These tools record real people using your site. Handle it properly:
• Mask all input fields by default: names, phone numbers, addresses, payment details, passwords
• Never record payment pages
• Exclude anything showing another customer’s data
• Disclose recording in your privacy policy
• Take advice on what consent you need under the DPDP framework before switching recording on
• Restrict who on your team can watch recordings
• Set a retention period and stick to it
Most tools mask inputs by default, but verify it yourself on a test submission before going live. This article is not legal advice.
Turn observations into changes
A heatmap is not a conclusion. The loop is:
1. Observe: 60% of mobile visitors never reach the enquiry form
2. Hypothesise: the form is too far down; a sticky WhatsApp button would capture them earlier
3. Change: add the sticky button
4. Measure: did enquiries rise?
Change one thing at a time, or you will not know what worked. Where traffic allows, test it properly: see our A/B testing guide.
Combine with the rest
Tool | Answers |
Analytics | What happened, and how much |
Heatmaps | Where attention and clicks went |
Recordings | Why, for individual visitors |
Surveys and exit polls | Why, in the visitor’s own words |
A/B testing | Whether your fix actually helped |
Analytics finds the leaking page. Heatmaps and recordings explain the leak. Testing confirms the repair.
Common mistakes
• Recording every page and never watching any of them
• Drawing conclusions from five sessions
• Mixing mobile and desktop in one heatmap
• Watching recordings for entertainment rather than with a question in mind
• Ignoring privacy and masking
• Finding problems and not fixing them, which is the most common outcome of all
A practical routine
Once a month, with a specific question:
1. Pick one page with poor conversion
2. Look at its scroll and click maps, mobile and desktop separately
3. Watch ten filtered recordings
4. Write down the three biggest friction points
5. Fix one
6. Measure for a month
7. Repeat
Frequently asked questions
Do these tools slow down my site? They add a script, so there is some impact. Load it asynchronously and check your page speed after installing.
Can I see who a visitor was? You should not, and you should not try. Keep recordings anonymous and mask all personal data.
Is this useful for a low-traffic site? Recordings are, even at low volume. Heatmaps need more sessions before they mean anything.